Table of Contents
Become benchmark notes
The goal of this numerical experiment is to calculate first order diffraction intensity from a simple surface relief grating made of silver, as suggested by Become partners from JCMWave.
The grating has period of w1 = 1000 nm and is formed by protrusion of width w2 = 500 nm and height h = 60 nm. The refractive index for the wavelength of λ0 = 619.9 nm is (0.131+3.88i). Illumination is from normal direction, P-polarized, Goal is to investigate convergence of quantity of interest, which is the first order maximum s+1. This should be roughly 0.186.
2D calculation
Calculations in 2D are performed using the GSvit2D solver which is an almost unused extension of GSvit to 2D calculations. As this was very outdated, most of the algorithms had to be implemented, including near-to-far field calculation and various materials treatment including dispersive metal treatment via PLRC algorithm.
To test the correctness of the newly implemented code we compared a simple transmission grating diffraction pattern to the analytically known solution. Total/scattered field approach was used to inject the plane wave normally to the plane containing the aperture or multiple apertures. TE mode calculation was used, which should mean the p-polarisation case as requested. Near-to-far field calculation domain was set up to be outside of the plane wave source region, so only transmitted field was propagated to the far-field. Time domain far field calculation was used. Far field data were calculated for wide range of angles for debugging purposes (i.e. not only for the directions of the particular diffraction orders).
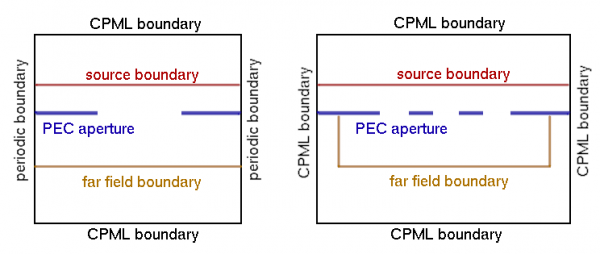
There are at least two possible ways how to treat the grating in FDTD calculation. First of all, we can setup the grating physically in the computation domain, as large as possible, run the calculation and evaluated the far field response. As we are usually interested in an infinite grating response, this would mean an infinite computational domain. Instead, we can use periodic boundary conditions, compute only one motive and evaluate the far field data. This still does not provide the results if the far field data are evaluated only from the single motive, we need to evaluate it from many virtual repetitions to get the impact of some number of motives. We call this periodic NFFF in the next text. In most of the graphs here we show complete diffraction pattern. However, if we are interested in the maximum in some diffraction order direction, it is much simpler and it seems that this is the preferably used approach - we calculate the far field value only at the diffraction order maximum. Luckily enough, this value is dependent on the aperture only, which constructs the envelope for the diffraction pattern, so in this case one could work only with a single aperture. However, to calculate the whole diffraction pattern is a good way how to debug the problem. The schematics of the calculations is here:
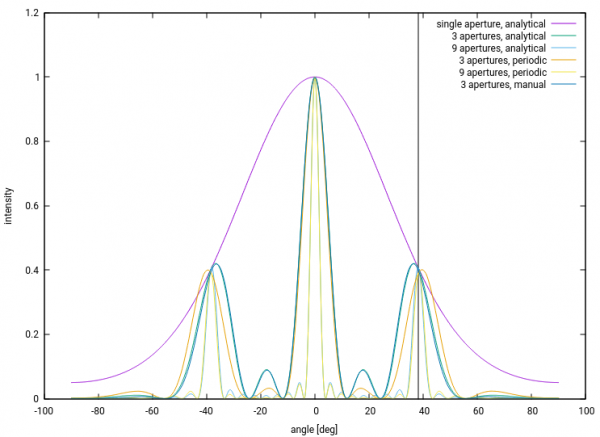
A comparison of the different evaluation methods is shown below, also showing the first diffraction order direction by a vertical line. It shows a transmission grating that is evaluated different ways. First of all, analytical results for single aperture, for three apertures and nine apertures are shown. Results from periodic calculation (based on a single motive) where the far field is evaluated from three and nine virtual repetitions are then compared to the case where the calculation is not periodic and three apertures are physically existing in the computational domain.
An important message is that using the periodic approach with only a small number of repetitions does not work as it does not take into account the field on sides of the computational domain. For large number of periodic repetitions we get results that are same as analytical results. If we manually extend the computational domain and include all the apertures, results agree with the analytical results also for small number of apertures. See the technical explanation listed below for our reference.
Technical remarks: To calculate single aperture or three apertures in one computational domain correctly it is important to add the side boundaries. It is also crucial to use the best available absorbing boundary condition (CPML) throughout all the calculations, otherwise we get everything dependent on the computational volume. If we manually setup the grating with few apertures, result corresponds to the theory. However, if we use periodic boundary conditions and virtual repetitions NFFF, this works only if we sum many virtual repetitions for far field calculation, at least about 7. If we would use this approach for only few apertures (e.g. 3) it would lead to a wrong result (even if it still looks fine at the diffraction order angle, is it only by chance?). When higher numbers of apertures are evaluated in this way (e.g. 11), the values of the central maximum can drop down and using a smaller time step helps to correct this effect. This might be related to the far field integration (linear interpolation works better when signal is not changing so rapidly), however it is still unclear if this is the only effect. The backup files for this calculation are here.
Accuracy aspects (evaluated on the single aperture transmission):
- effect of time step is small, prolonging it from dt=0.5 of Courant limit to 0.25 does not change the shape of the curve in a detectable way.
- effect of absorbing boundary type or distance to the boundary much is not very large (mostly invisible, below percent?). The transmission around zero order is larger slightly when Liao condition is used instead of CPML and CPML is recommended to prevent impact of resonances in the computational domain in longer calculations.
- effect of NFFF box size is up to 6 percent for the maximum difference of intensities at the first diffraction order (NFFF box sizes from 100×20 to 340×130, when y size is evaluated from the aperture plane and even for maximum NFFF the boundary in x is about 200 voxels far). Smaller NFFF box seems to be better; when it is enlarged, artefacts can be seen.
- There is always a slight difference for the single aperture calculations between analytical model that does not go to zero for maximum angles, and numerical model that goes to almost zero.
The transition from transmission geometry to reflection grating geometry was done first with perfect electric conductor as a grating material. The same motive as in the Become grating is used and also the same voxel spacing (5 nm), it is only from a different materials for calculation speed and simplicity. All the computational details were same as in the previous example. To get the data normalization to the incident wave intensity we used perfect electric conductor plane only (no grating motives) and evaluated the electric field intensity in the far field point corresponding to surface normal direction.
Here, we don't have any analytical result to which we could compare. We could therefore only compare the periodic calculation (using field from single motive with periodic boundary conditions and periodic NFFF) and the manual calculation (big model with all the motives).
The two models that were compared are shown below.
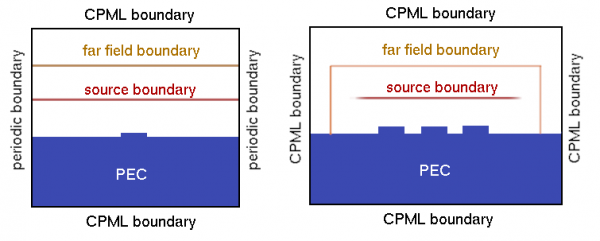
The periodic calculation was done the same way as for the transmission grating, only the position of the NFFF integration area was changed. I For the large manual calculation, in contrast to the previous case, we could not use the simple plane wave to illuminate the grating as this would lead the source to cross the NFFF domain, which leads to wrong results (all sources must be inside to get physically valid result). We have therefore truncated the plain wave at the edges with a Gaussian decay function, so whole source is now inside the NFFF domain. This leads to a diffraction effect due to finite source size, which is however small and has minor impact on the result.
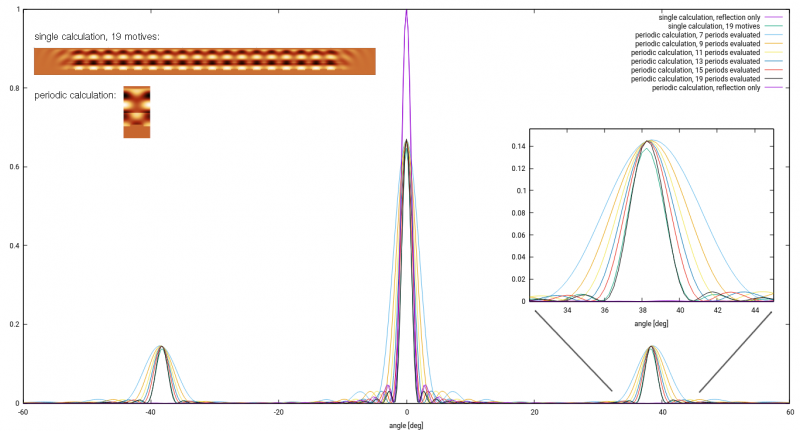
The results show that the correspondence between the 19 apertures manual model and the periodic model with evaluating 19 near-field repetitions for the far field calculation are comparable to about 4 percents. Better correspondence might be obtained if the manual domain would be further extended or if the periodic calculation is run with bigger distance between the individual elements (boundaries, objects, integration domains) as observed always with NFFF.
The backup files are here.
The Become benchmark grating was setup the same way as the above test example. The grating was now formed by silver, using the PLRC metal handling approach. We have only increased the size of buffer between the computational domain border and the studied structure which is well known approach how to improve simulations response. All the other parameters we kept from the previous case. Normalization was again done via reflection from a perfect electric conductor surface.
The image below shows the normalized angular dependence of the diffraction from the (finite size) grating.
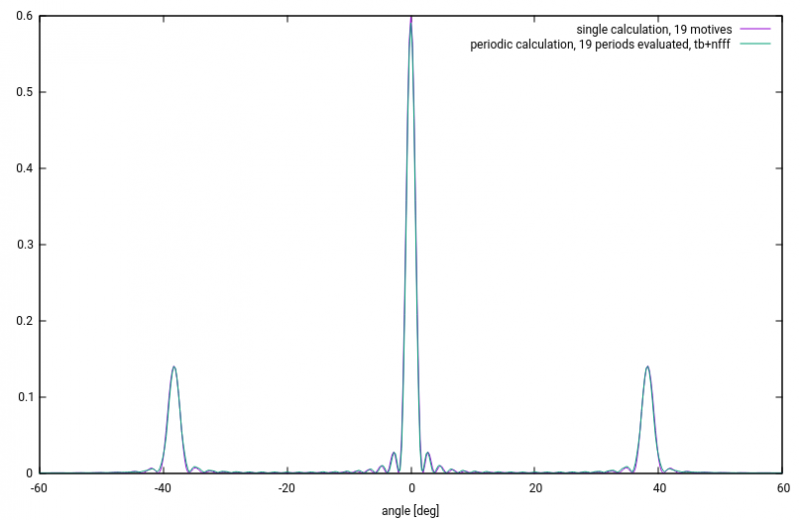
When inspected in detail, it can be seen that there is only a difference of about 0.2 percents between the two methods output for the first diffraction maximum, which was confirmed as a positive effect of bigger distance of the computed structure from boundaries. A bigger problem is, that the diffracted intensity is about 0.140 of the incident intensity, which is less than expected (the expected value is 0.186). Something has to be wrong.
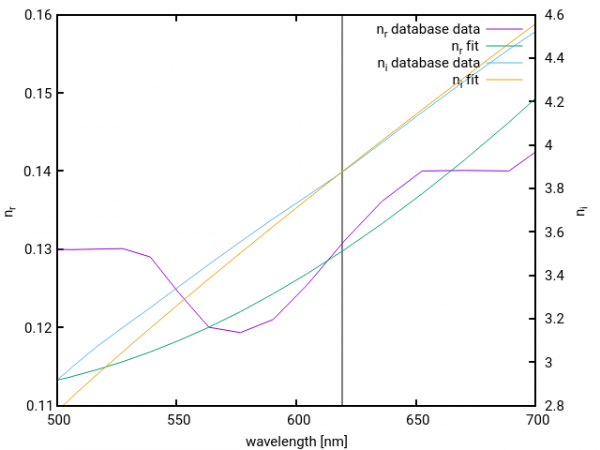
The first suspect is the refractive index. As we use the PLRC metal handling we can not enter the refractive index directly to the calculation. Instead we need to use some dispersive model, in our case based on two critical points. We have fitted part of the optical database data by the model to get closer to the prescribed values, however there are still small differences (unless we restrict the fitting spectral region much more, which would lead to quite unrealistic dispersive model). The correspondence of the fitted refractive index and database data is shown below.
To compare its impact on results, here is a list of different metal model settings and results:
- the fitted metal setting: 6 1.03583 0 1.37537e+16 1.25733e+14 2.1735 -0.504659 7.60514e+15 4.28131e+15 0.554478 -1.48944 6.13809e+15 6.62262e+14 means n=(0.129 + 3.87i) and leads to first order diffraction intensity of 0.140
- default metal setting: 6 0.89583 0 13.8737e15 0.0207332e15 1.3735 -0.504659 7.59914e15 4.28431e15 0.304478 -1.48944 6.15009e15 0.659262e15 means n=(0.036 + 4.147i) and leads to first order diffraction intensity of 0.143.
The easiest way how to check the metal properties is to calculate the reflectance of a bulk. This uses very similar geometry to our calculation (TSF source, periodic and CPML boundaries), so we can expect that there are not many additional potential error sources when comparing to our calculation. Here we don't need to use NFFF (which is distance dependent), so the values don't need any normalization. Reflectance of the default metal for this particular voxel spacing and other settings is 0.983 Reflectance of the fitted metal model is 0.9587. Result from the Filmmetrics reflectance calculator is 0.9678, which is something in between. Finally, error in the reference value calculation (PEC reflection) is below 0.001 percent which certainly cannot affect our results. So, this all is probably also not the source of problem (however might be compared to reflectance coming from FEM).
Another suspect is the voxel spacing. In the first tests for 5 nm and 10 nm voxel spacing the resulting diffraction maximum was nearly same when studied on PEC (less than 0.5 percent difference). In past we have however observed that the voxel spacing has an impact on the reflectance on real metals (not on PEC, which is ideal). Too coarse mesh cannot treat the metal correctly, probably due to its small skin depth. Here, in a quick check, for the fitted model we get reflectances of 0.959 for 10 nm voxel size, 0.962 for 5 nm voxel size and 0.958 for 2 nm voxel size, when roughly evaluated from the local fields. This means differences up to 1 percent. However, the difference between the expected value and the simulated value is about 20 percent. So, reflectance itself is probably also not the source of troubles.
The voxel size could impact the overall performance in more general way than only to wrong reflectance. The very preliminary tests (with less accurate boundaries and other imperfections) however did not show large dependence on the voxel size, at least for reasonable voxel sizes, in the range of 3-12 nm. Also, scaling the present model twice (using 5 nm instead of 10 nm voxel spacing and doubling all voxel distances), leads to the diffraction maximum of 0.142, which is almost negligible increase. Similarly, voxel spacing of 3.33 nm leads to diffraction maximum of 0.143 at already much higher computational costs. However, this could be still studied more in detail.
3D calculation
To be completed after we are happy with the 2D case, should be simpler as 3D code is used for years already.
Summary
So far the result is not the expected value, which needs to be investigated first. Many of the convergence studies, or studies of impact of different simulation settings on the results were performed already or could be easily re-run when this is more clear.
The sensitivity of 2D calculations results on the settings (computational domain size, time step, near-to-far field transformation, et.c) is in the order of few percent, the dominant effect of this uncertainty is the near-to-far field transformation. This does not affect the cases when these conditions are kept same in a series of calculations (so relative changes can be calculated with much higher accuracy), however it certainly affects the absolute values, e.g. when comparing a single calculation to completely different calculation or experimental data.
TODO
The aspects that need further investigation or tuning:
- far-field calculation postprocessing speedup, now very slow, printing many debugging data.
- evaluate the voxel size vs. speed vs. accuracy for the benchmark, or anything else to benchmark
